
Scrape | Analyse | Visualize
A Data Scrape-Analyse-Visualize and Web App Project
ITea Web App
The ITea project aimed to re-evaluate the ratings and reviews of some hospitals in Lower Saxony using proprietary algorithms. To do this, the relevant data was scraped from the Internet, machine learning methods were used, and the new data obtained by re-evaluating the data was presented on a web app. The relevant data came from maps.google.com and Klinikbewertungen.de.
Web scraping
Obtaining reviews from the sites Klinikbewertungen.de & Google Maps
This data was scraped with Selenium via Google Chrome Web Driver.
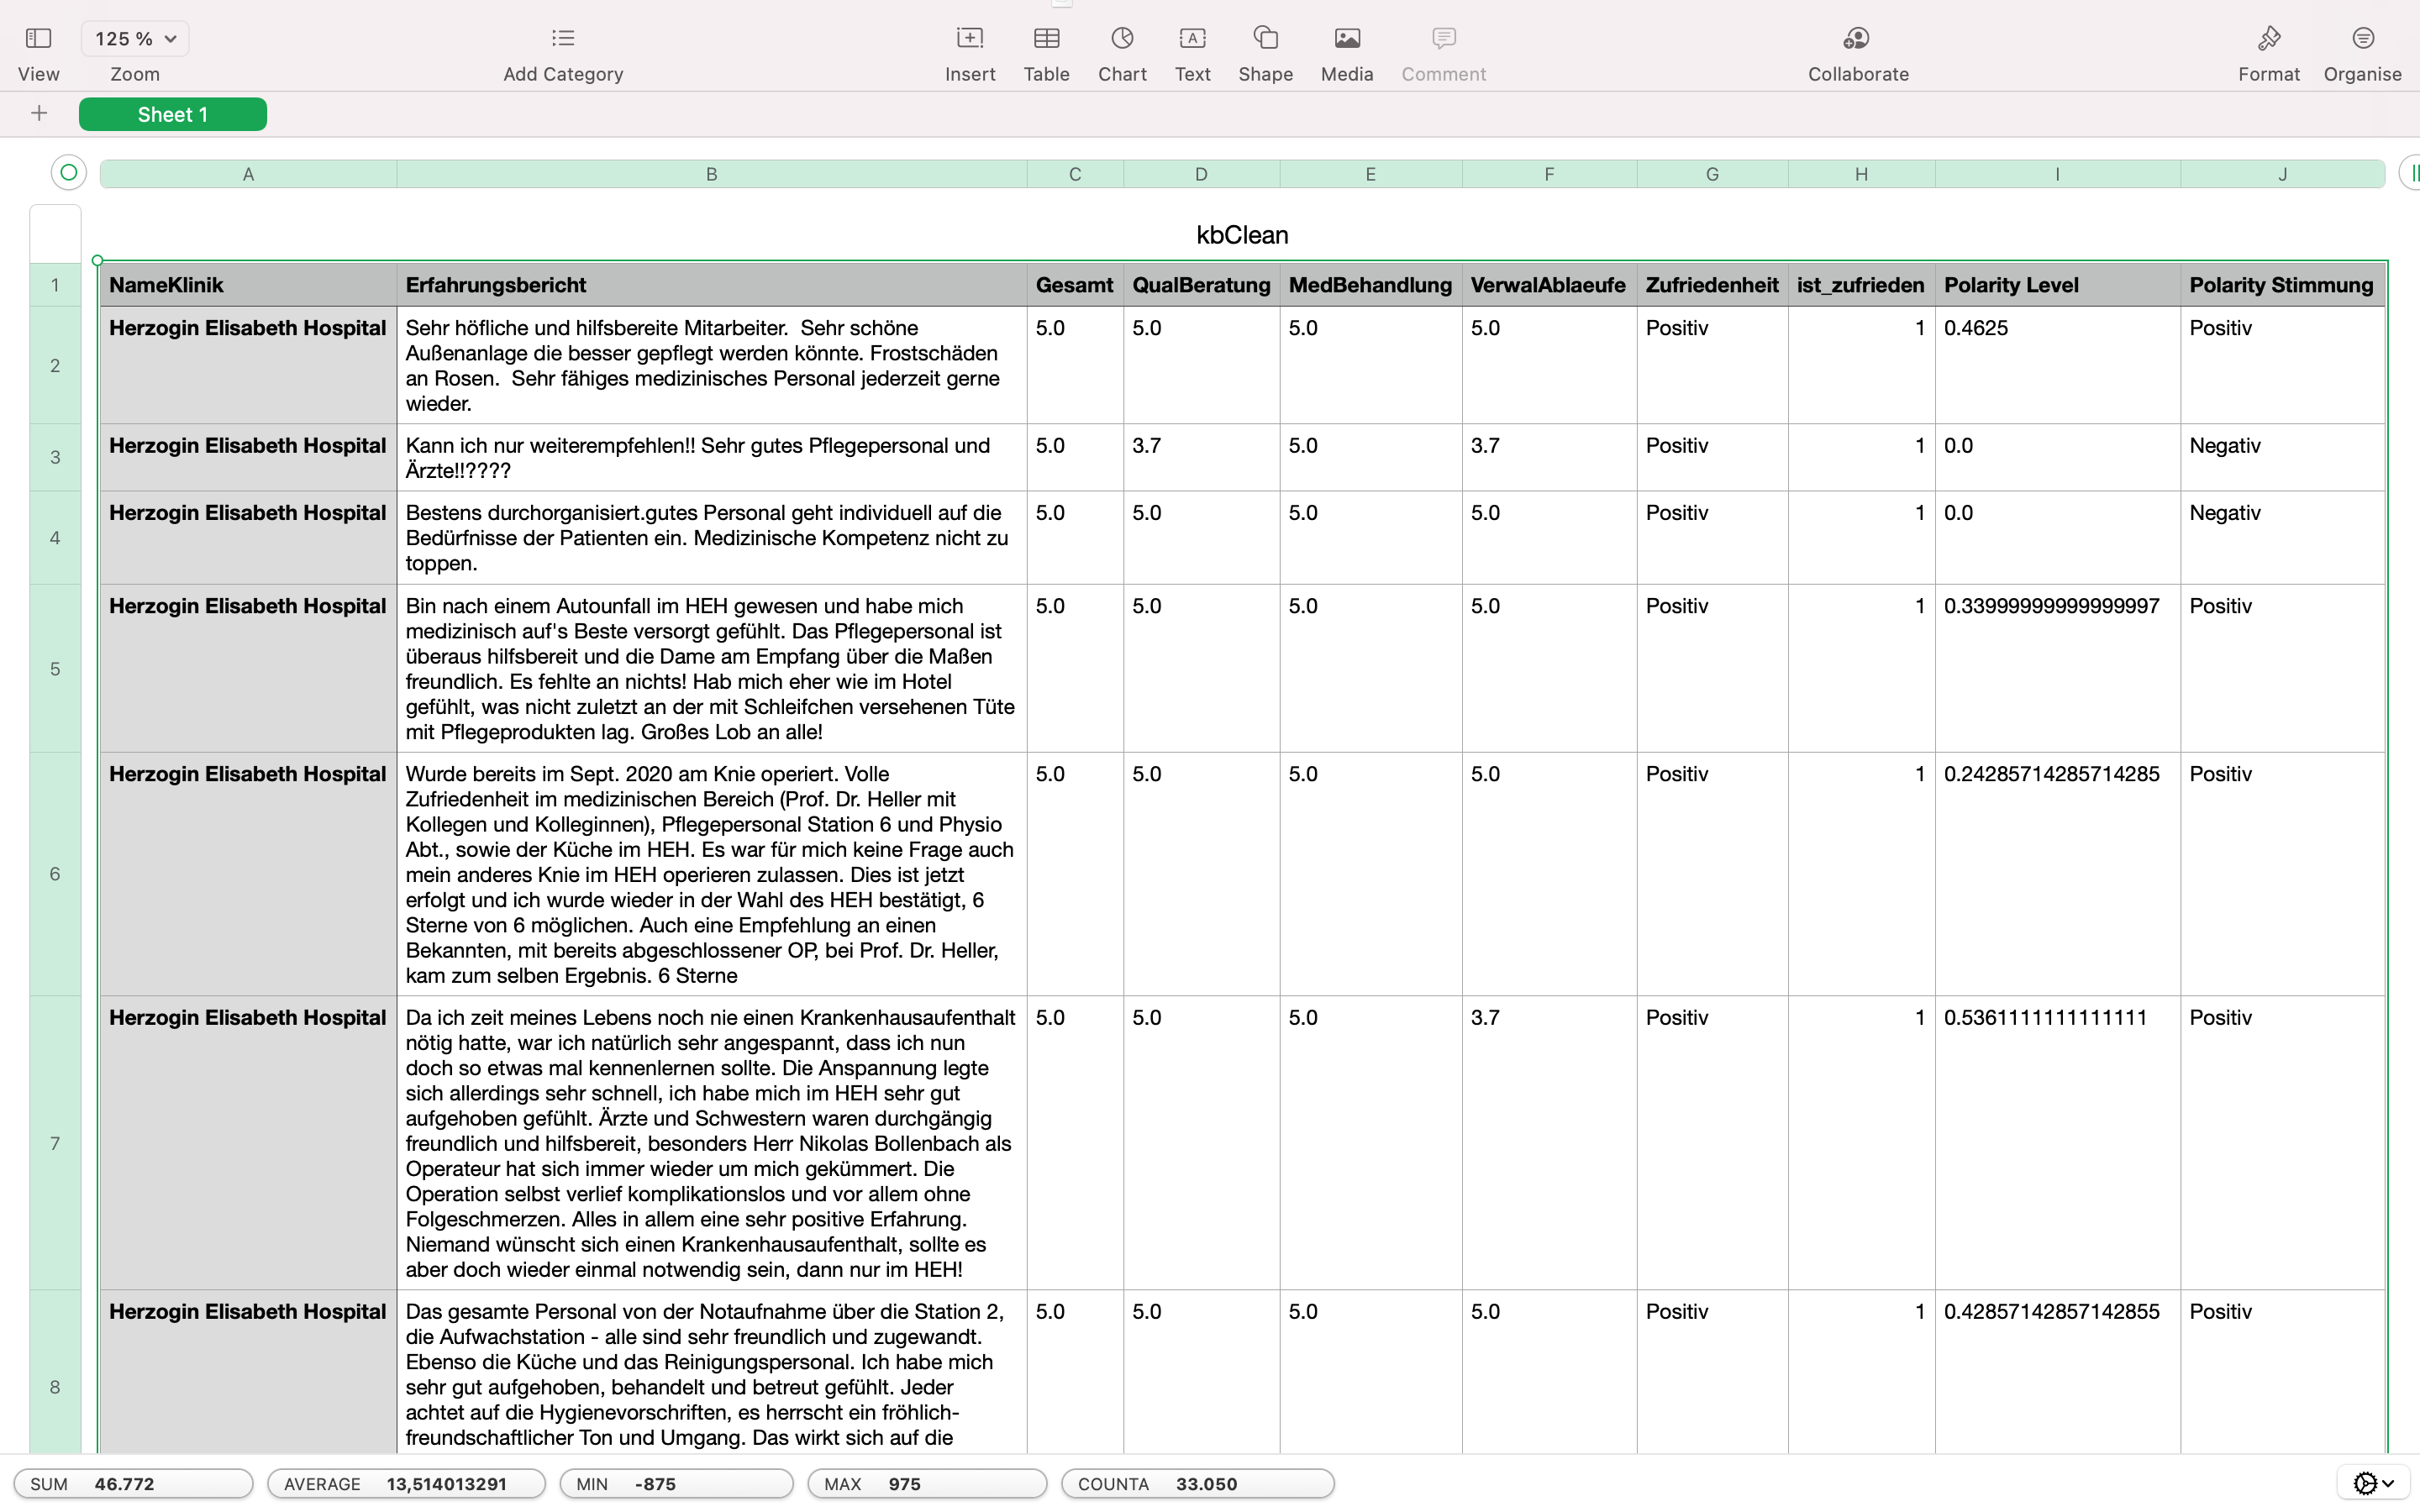
Data Science
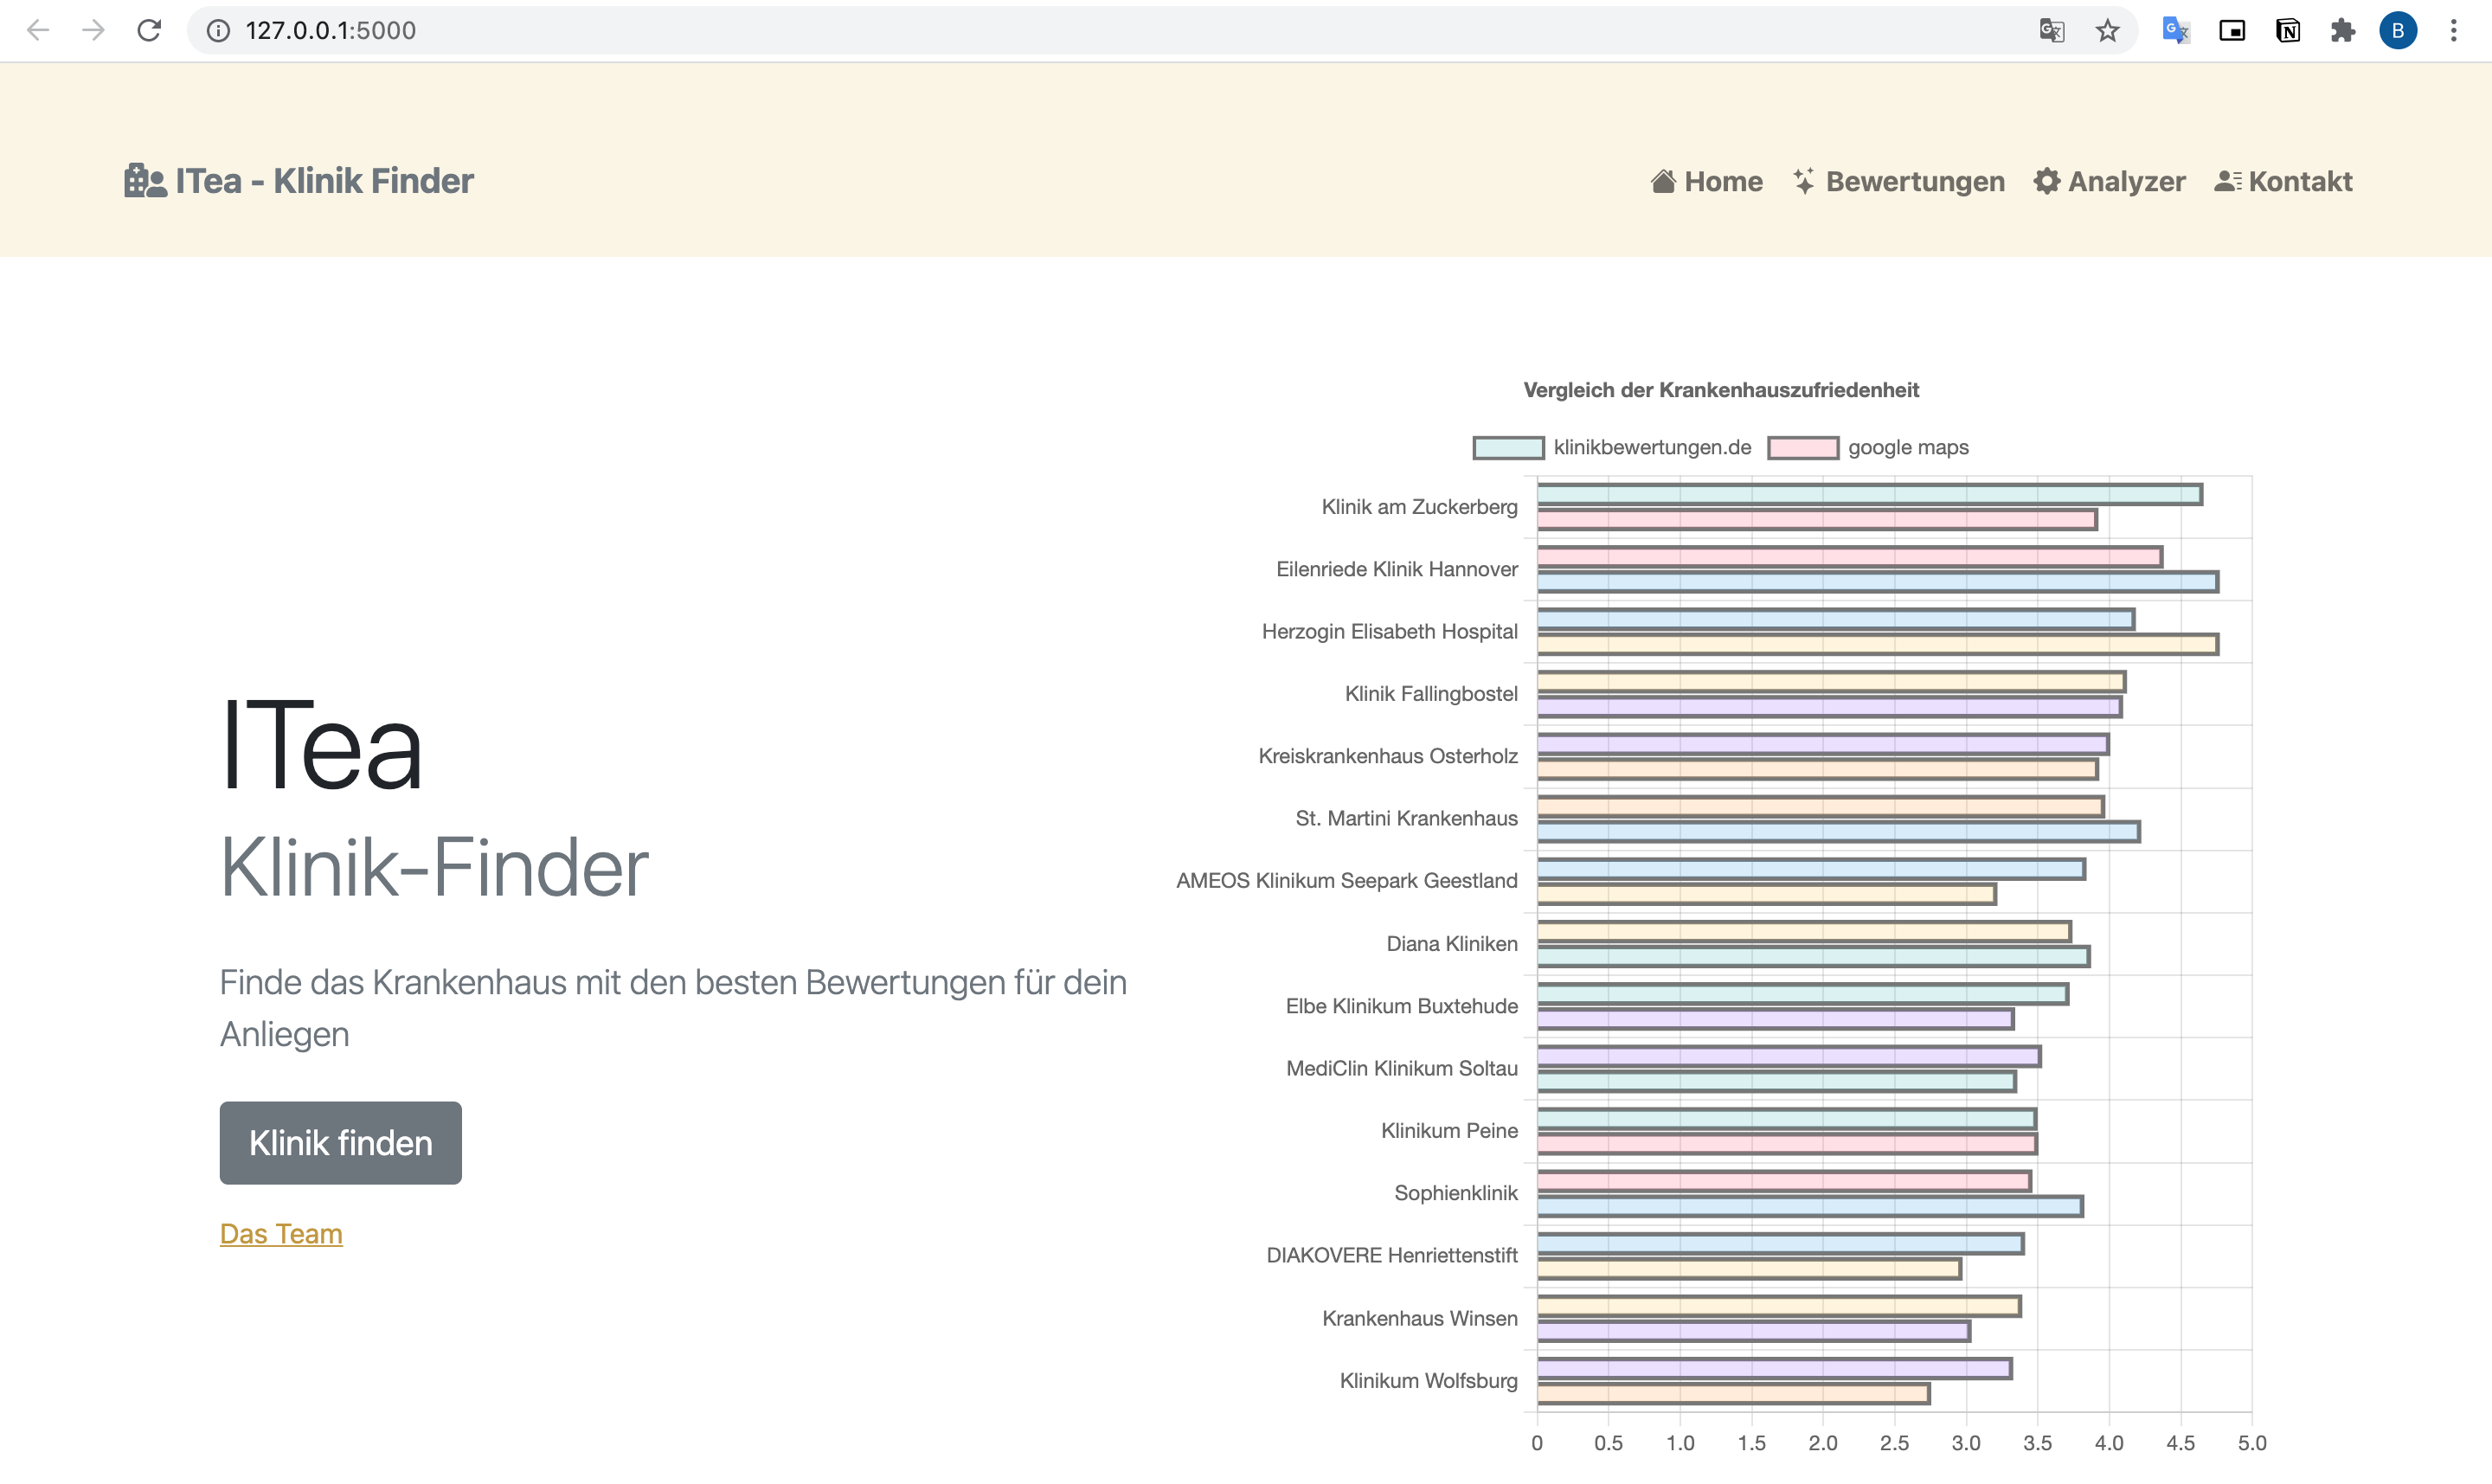
A machine learning model . The obtained data was cleaned in Jupyter notebook with Python using Numpy and Pandas libraries, and saved again as a csv file to be used later on for the Flask Web App. Clean Data is also visualized using seaborn, matplotlib libraries as well as JavaScript (chart.js)
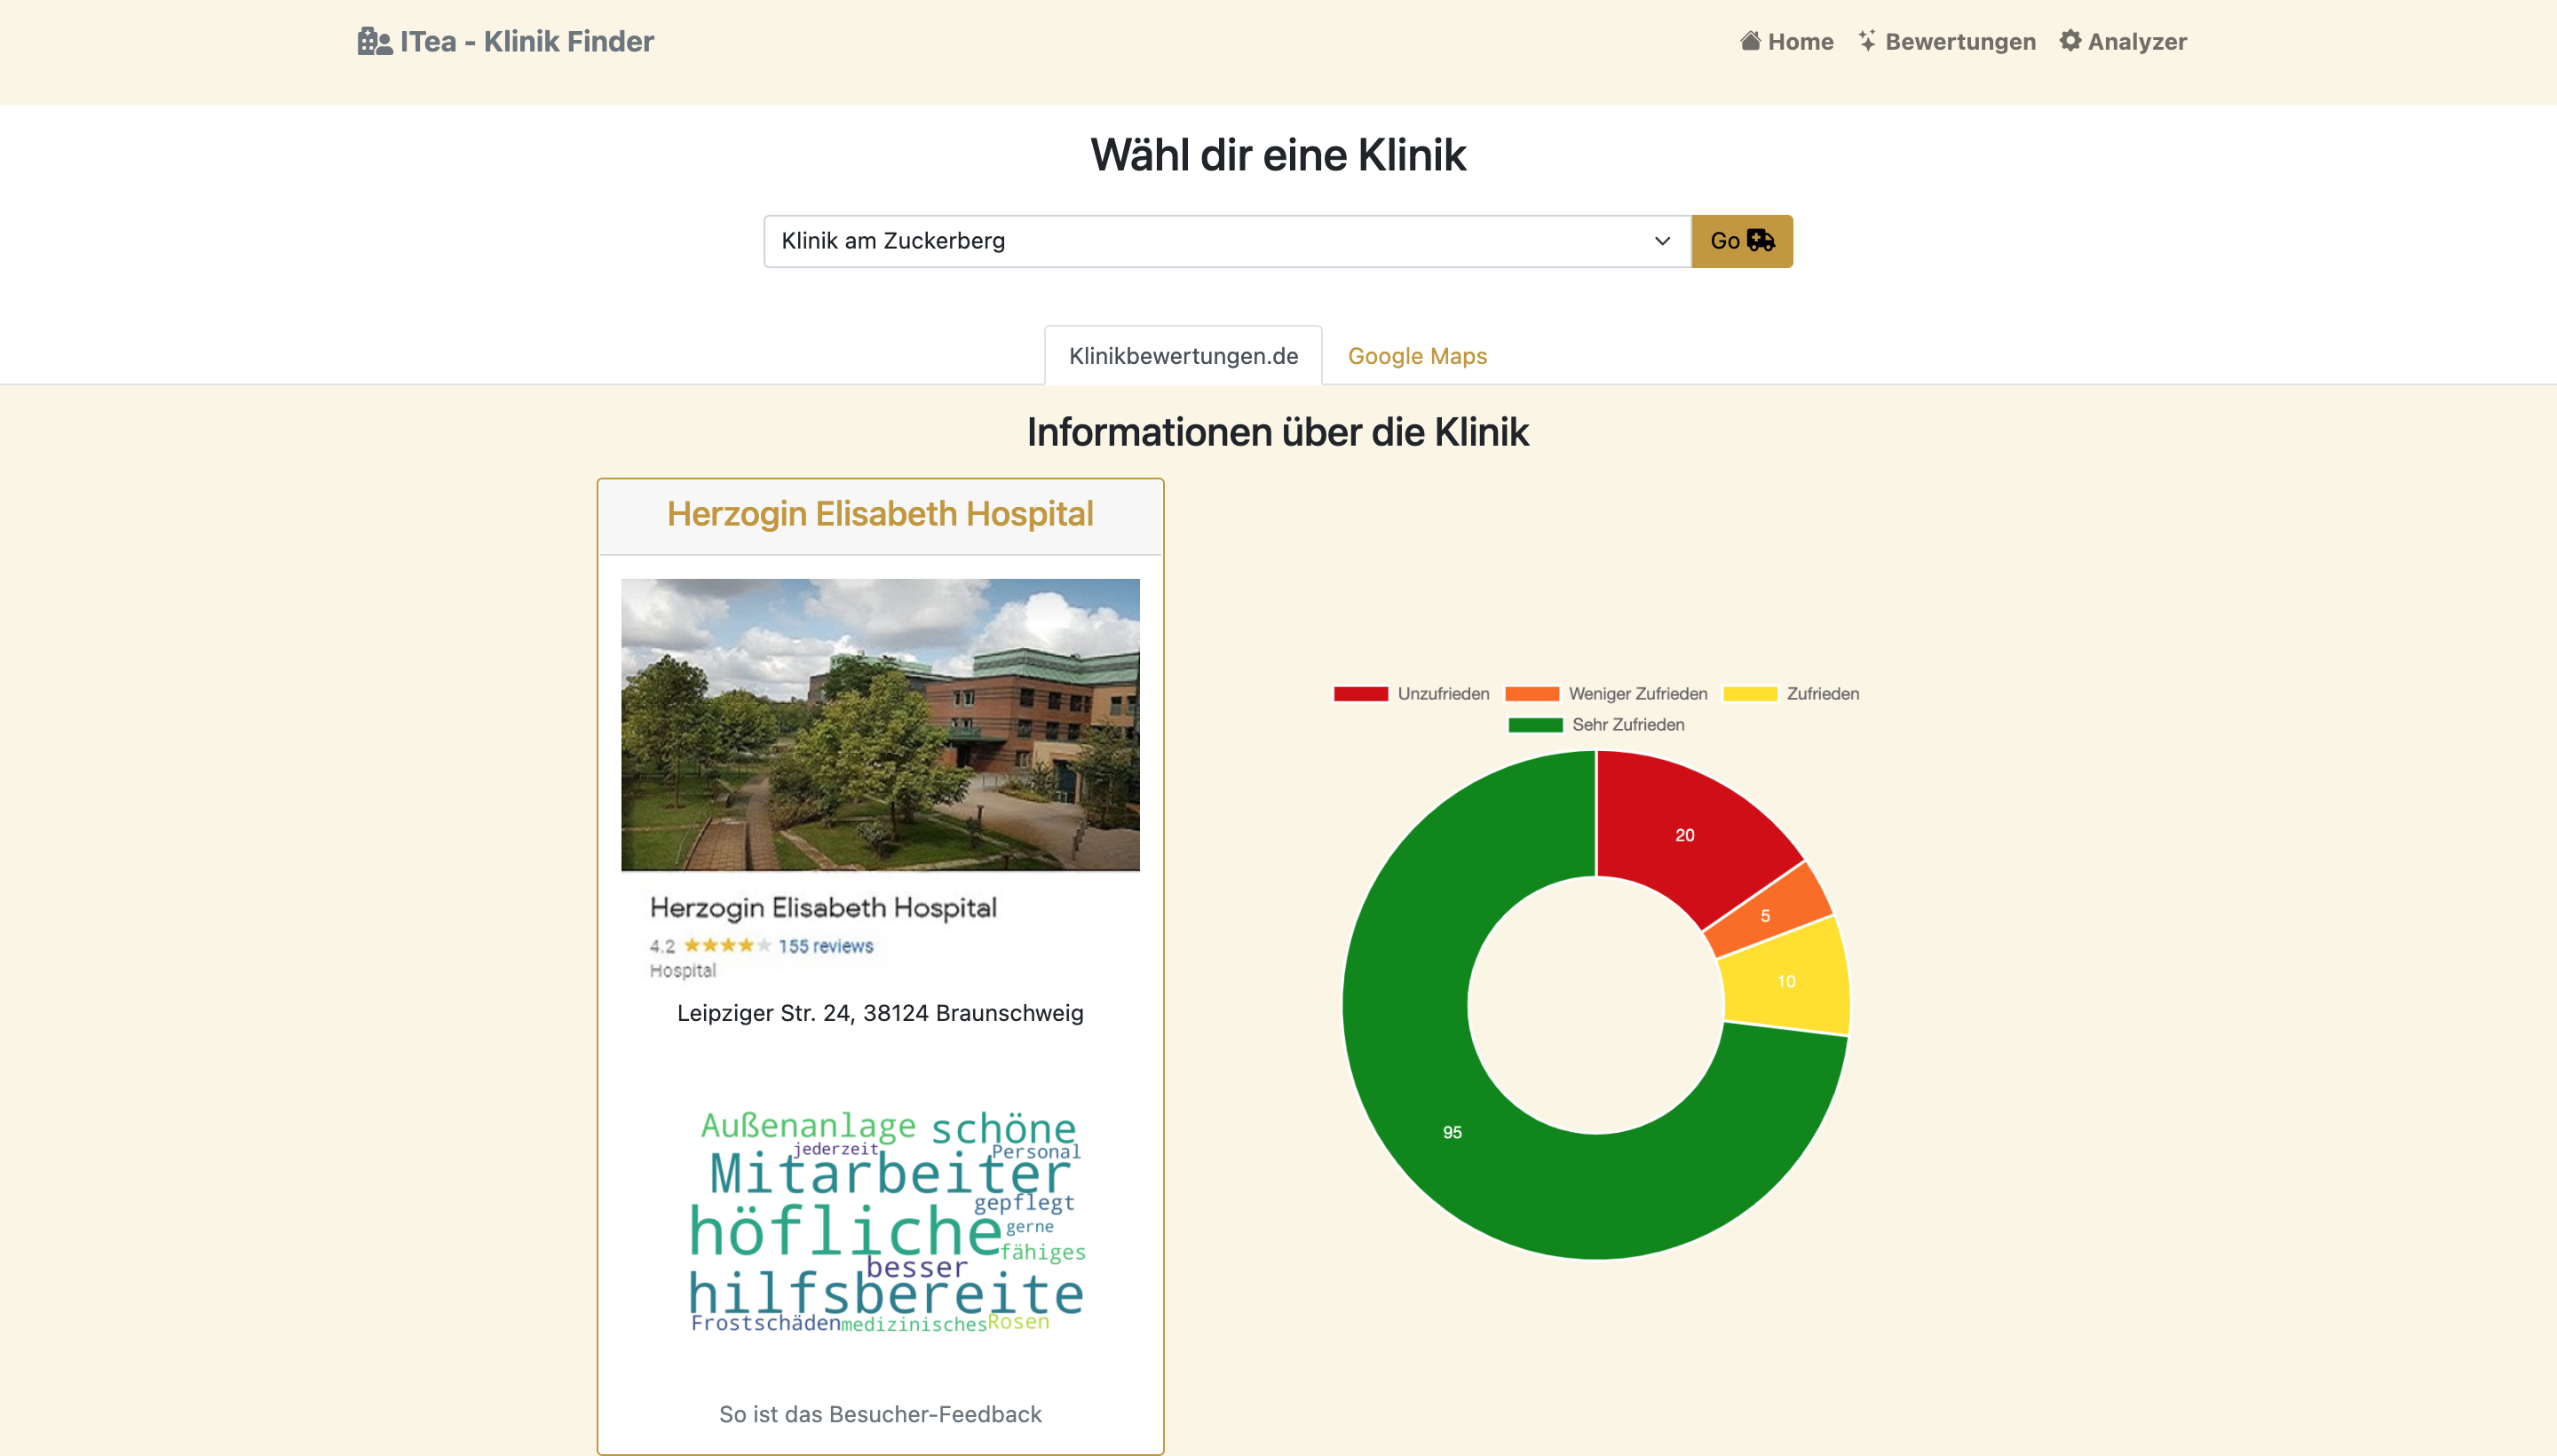
Web App
Written in the front end with JavaScript and Bootstrap, in the beck end with flask. Consist of Homepage, Reviews and ITea (our machine learning tool)
Team ITea
We worked as a team of three and applied the Project Management skills with Scrum methodology. Through the project Git versioning also Github and Notion was used. With this project we gaind hands-on experience in the fields of Data Science.
The project was a success as a result of four weeks of hard work. With this project, users can not only compare clinics in Lower Saxony, but also use our machine learning tool ITea.
If you would like to see the whole Project on Github;